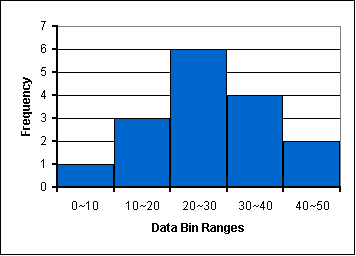
A histogram shows two sets of numerical data using bars of
different heights. In a histogram one
set of data deals with a count of non-discrete numbers occurring (frequency).
The other set involves continuous or presumed continuous numerical data (e.g.
measurement of length, percentage, measurement of mass). Although histograms look similar to
what is known as bar charts, a histogram groups numbers into ranges, while in a
bar chart each bar is a specific number.
In the above histogram you can see that the histogram does in fact group
the numbers into ranges (as seen on the x axis).
The map URL is: http://quarknet.fnal.gov/toolkits/new/histograms.html

No comments:
Post a Comment
Note: Only a member of this blog may post a comment.