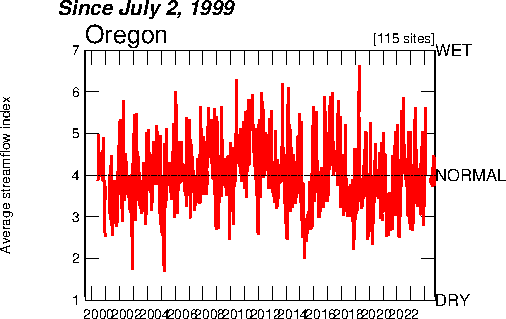
The easiest way to understand an index value plot is to
first best understand what an index is.
In index is a statistical indicator or number derived from a formula,
which is used to characterize a set of data. An index value plot is a type of visualization map that is
plotted on a line graph. What an
index value plot allows one to do is look at variations over a situation. The above index value plot shows
the rainfall recorded in inches in Oregon from 1999-2006.
The map URL is: http://mylifeasihaveknownit.blogspot.com/2008_12_01_archive.html

No comments:
Post a Comment
Note: Only a member of this blog may post a comment.