A stem and leaf plot is something that almost everyone was
introduced to in elementary school.
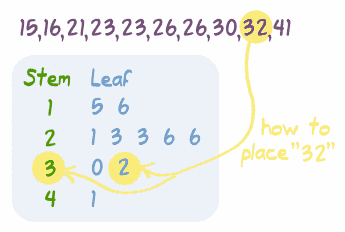
A stem and leaf plot is a way to show quantitative data in a graphical
format. In a stem and leaf plot each
data value is split into a "leaf" (usually the last digit) and a
"stem" (the other digits).
The stem values are listed down, and the "leaf" values are
listed next to them. The above
image shows a stem and leaf plot as well as how to place a number into a stem
and leaf plot.
The map URL is: http://www.mathsisfun.com/data/stem-leaf-plots.html

No comments:
Post a Comment
Note: Only a member of this blog may post a comment.